Candlesticks Patterns: For Beginners
Howdy Howdy!
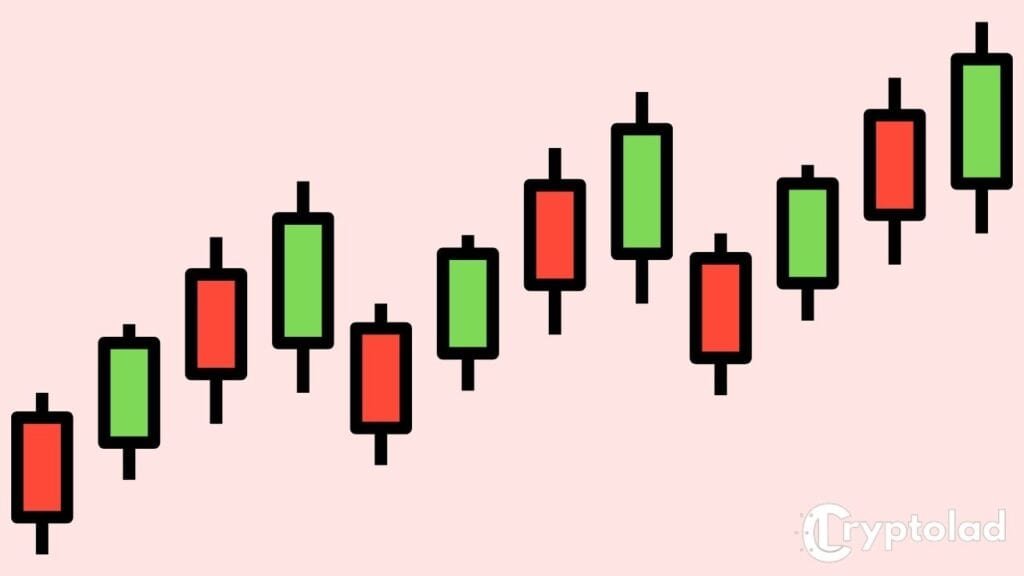
If you're new to trading, you're probably looking at these green and red bars on your chart with no real idea what they mean.
I don't blame you... reading charts can be very tricky as a beginner, but you'll soon see that these little colorful bars are actually your best friend when it comes to predicting the price of a cryptocurrency.
Understanding how to read candlesticks is essential as an investor or trader in any market.
Let's get into it...
What Are Candlesticks?
The idea of candlesticks was first conceived in the 1700s by a Japanese rice trader named Munehisa Homma.
Candlesticks indicate the price history of a particular asset.
Candlesticks are arguably the most efficient and effective way of reading charts.
By using a simple diagram, they can convey a huge amount of information to the reader, such as opening price, closing price, highest price just to name a few.
How To Read Candlesticks
The great thing about candlesticks is not only do they convey an extraordinary amount of information, but they're also very easy to read once you know what you're looking at.
Basically, candlesticks are telling you a story of price action over a specific period of time.
Green Candlestick Explained

Green candles are bullish candles, which means the price has gone up during a specific time period.
Red Candlestick Explained

These are considered bearish candles, which means the price of a particular asset has gone down during a specific time period.
Doji Candlestick Explained
This means the price of a particular asset opened and closed at the same price or very close to it.

By looking at the diagrams above, you're able to determine the opening price, closing price, highest price, and closing price of a particular asset over a specific time period.
As you can see, reading candlesticks is pretty easy once you know what each point represents.
If you'd like to learn some more advanced candlestick patterns, check out 10 Candlestick Patterns Used in Technical Analysis
If you need a further explanation, feel free to comment below or contact us on social media, and we'll be happy to give you an in-depth explanation.
Happy Trading!