10 Candlestick Patterns Used in Technical Analysis
Candlestick patterns are essential tools used in technical trading.
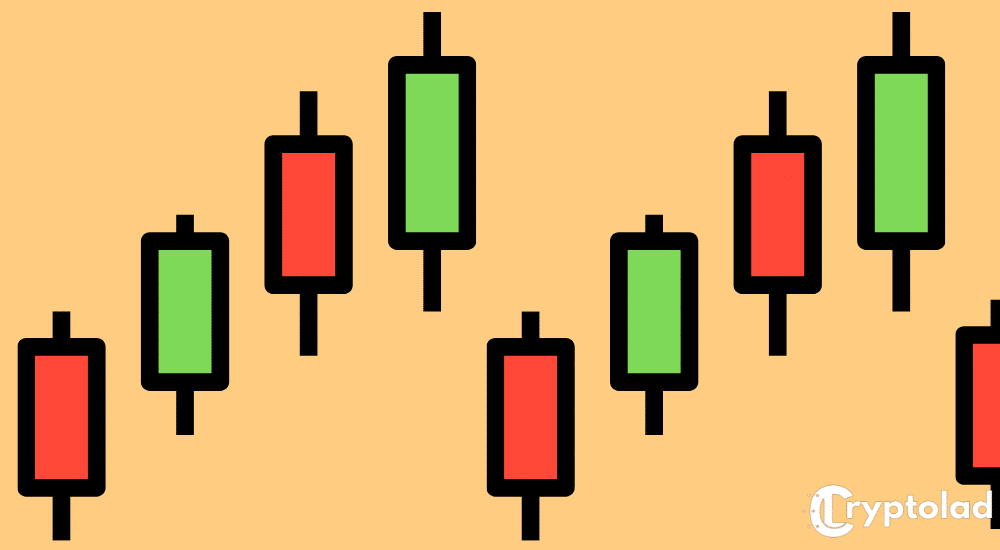
They pack data from multiple time frames and convert it into single price bars. They are much more useful than the conventional low-close, open-high bard or simple lines formed by connecting the closing prices’ dots.
Once the price direction is completed, candlesticks form patterns that predict the direction of prices.
To add some depth to this informative technical tool, proper colour-coding is done.
History of Candlesticks

Candlestick patterns date back to the Japanese rice traders of the 18th century. Where a man named Munehisa Homma invented the system as a more proficient method of trading rice.
The Western world became aware of candlestick patterns for the first time in 1991 through Steve Nison’s book titled “Japanese Candlestick Charting Techniques.” Traders can now successfully identify many of these formations, each with unique names like The Evening Star, Bearish Dark Cloud Cover, Three Black Crows, and more.
Additionally, single bar patterns, including The Hammer and Doji, have been brought into the huge Short- and Long-Side Trading Strategies book.
Reading candlestick patterns allows traders to analyze market trends and interpret them for the future, which ultimately leads to better decision-making.
There are various formations of candlestick patterns that will signal either bearish or bullish movements.
For today’s discussion, we will be briefly discussing 10 such formations every trader should be acquainted with to make trading in the markets easier (and safer).
Are Candlestick Patterns Reliable?

It is to be noted that not all candlestick patterns are equally reliable.
The overwhelming popularity has taken chunks off its reliability as they’ve been evaluated by multiple hedge funds paired with their algorithms.
Such well-funded players depend on lightning-fast performance to trade with traditional fund managers and retail investors who carry out complex technical analysis strategies.
Hedge fund managers use software to trap entities searching for high-odds bearish or bulling results in simpler terms.
Reliable patterns always appear, though, providing an opportunity for long- and short-term profit-making.
Amidst all the patterns available, ten candlestick patterns boast excellent performance as interpreters of price momentum and direction.
Each one functions with its environment’s price bars context to predict lower or higher prices. They are time-sensitive too – in two ways:
- If the pattern has been completed, the potency falls three to five bars exceedingly fast.
- They only work if the chart is reviewed, whether it be multiple times or once a day, weekly, or monthly.
Candlestick Performance Chart
Thomas Bulkowski laid the foundation for this kind of analysis by building the performance rankings in 2008 for candlestick patterns.
His book titled “Encyclopedia of Candlestick Charts” provides statistics for two types of potential pattern outcomes:
- Continuation – These patterns predict an elongation in the present price direction.
- Reversal – Reversal patterns signal an alteration in the direction of price.
What Does Bullish Mean?

“Bullish” is a term used by investors if they believe the stocks' value or any security will go up.
A bullish investor is also called a bull and predicts one or multiple securities' prices will increase. This can be applied to any market scale.
Sometimes, these investors believe the entire market as a whole will go up, predicting general profits.
On other occasions, an investor may anticipate profits in a particular industry, bond, stock, collectible, or commodity.
For example, if an investor is bullish about XYC inc., they believe the specific company's share will rise.
A related meaning can be derived from a bull market. It occurs when prices, generally those of equities, are seeing a rise.
While not every stock needs to increase, the market's main equity indexes surely will.
In contrast to a bear market, the universally accepted percentage gauge doesn’t exist – meaning there is no fixed limit the rising rate must reach before it can be considered a bull market.
What Does Bearish Mean?
A bearish market gets its name from the assumption that a bear will swipe with its paw in a downward fashion.
This provides literature value but hasn’t been proved etymologically.
Similar to a bullish investor, a bearish investor gets another name – bear.
They believe prices will fall. Bearish investors can feel this way about a certain stock, specific sectors, or the whole market in general.
For example, if an investor believes XYZ's stock will go down soon, they are called bearish on that company.
If the investor predicts a market-wide dip in bonds, stocks, currencies, commodities, or alternative investments too, it is said that they are bearish as they anticipate a significant and sustained downturn.
For any market to qualify as a bearish one, securities prices have to fall by at least 20% for a key market index period.
Bullish & Bearish Candlestick Patterns: How to Tell the Difference
To understand and use the most popular candlesticks patterns, traders must understand how the market direction (trend) is linked to the patterns' inclination.
The table mentioned below summarizes the two main sections of price movements a candlestick pattern will show.
Bullish Candlestick Patterns
| Pattern | Trend Direction |
Doji | Bullish/Bearish (Indecision) |
Morning Star | Bullish (Reversal) |
Hammer | Bullish (Reversal) |
Bullish Engulfing | Bullish (Reversal) |
Piercing Pattern | Bullish (Reversal) |
Bullish Harami | Bullish (Reversal) |
Inside Bars | Bullish (Continuation) |
Long Wicks | Bullish/Bearish (Reversal) |
Bearish Candlestick Patterns
| Pattern | Trend Direction |
Doji | Bearish/Bullish (Indecision) |
Evening Star | Bearish (Reversal) |
Shooting Star | Bearish (Reversal) |
Bearish Engulfing | Bearish (Reversal) |
Bearish Harami | Bearish (Reversal) |
Inside Bars | Bearish/Bullish (Continuation) |
Dark Cloud Cover | Bearish (Reversal) |
Long Wicks | Bearish/Bullish (Reversal) |
Evening Star and Morning Star Candlesticks
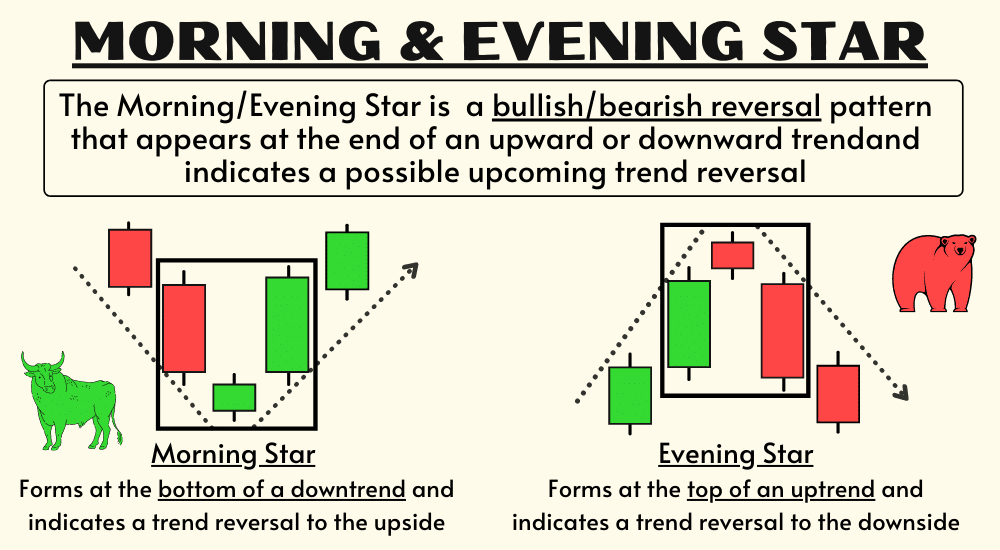
The morning and evening star candlestick pattern occurs at the end of downwards and upwards trends, respectively. They usually indicate reversal patterns.
The name is derived from the star shape that forms after the arrangement.
For this graph, the first candlestick faces the trend's direction, and a small-bodied bullish or bearish candle follows.
The third candlestick faces the reversal direction.
The requirement of trading this candlestick pattern is that a confirmation candle is needed in the direction of the reversal respective to that trend.
For instance, traders will look for a bullish candle after the morning star.
Bearish and Bullish Engulfing Candlesticks
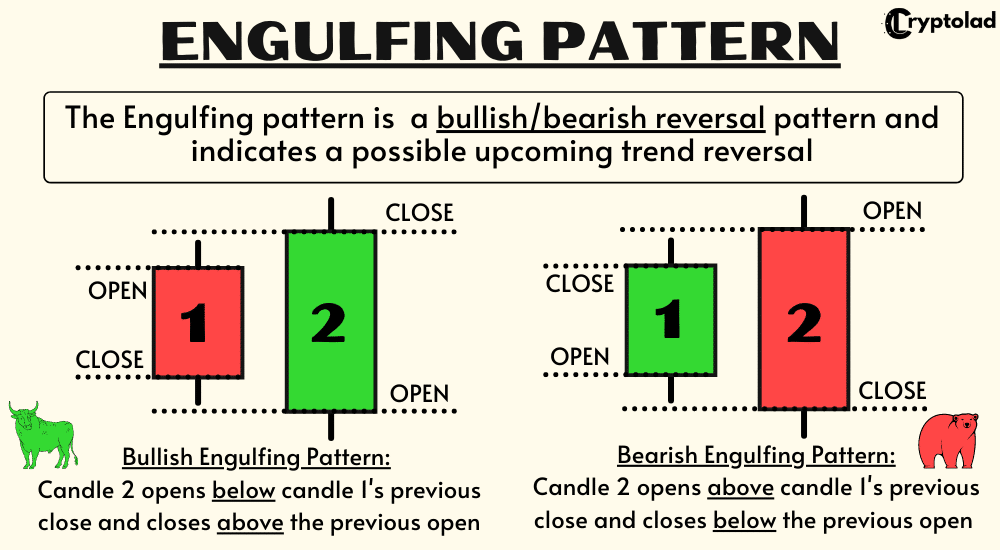
A bearish or bullish engulfing candlestick pattern might signal reversal patterns.
For the bearish engulfing candlestick pattern, a smaller bullish (or green) green candle is followed by a larger bearish (red) candle, the latter immersing the previous.
On the other hand, a bullish engulfing candlestick pattern displays bulls outweighing bears.
The green candle (bulls) entirely “engulfs” the first candlestick, which is the bears.
Doji Candlesticks
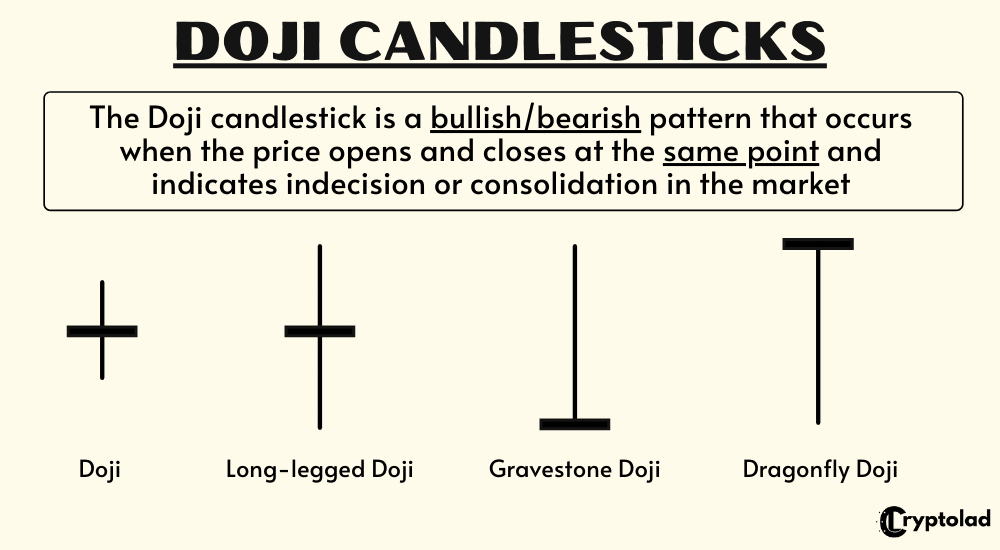
If there is indecision in the market, the Doji candlestick chart pattern becomes relevant.
This could also indicate a reversal of the present trend as well as consolidation.
This pattern can start at the bottom of the downtrend, in the middle of the trend, or even at the top of the uptrend.
Interestingly, the candlestick features a rather small body in the middle of the lower wick and long upper.
Hammer Candlesticks

The Hammer candlestick pattern is known to be a bullish reversal taking place at the end of a downward trend.
The candle formation is basically composed of a tiny body whereby the low, high, open, and close are approximately identical.
There is a long lower wick under the body – more than twice the candle body’s length.
The body might either be bearish or bullish, but bullish is taken to be more favorable.
Bearish and Bullish Harami Candlesticks
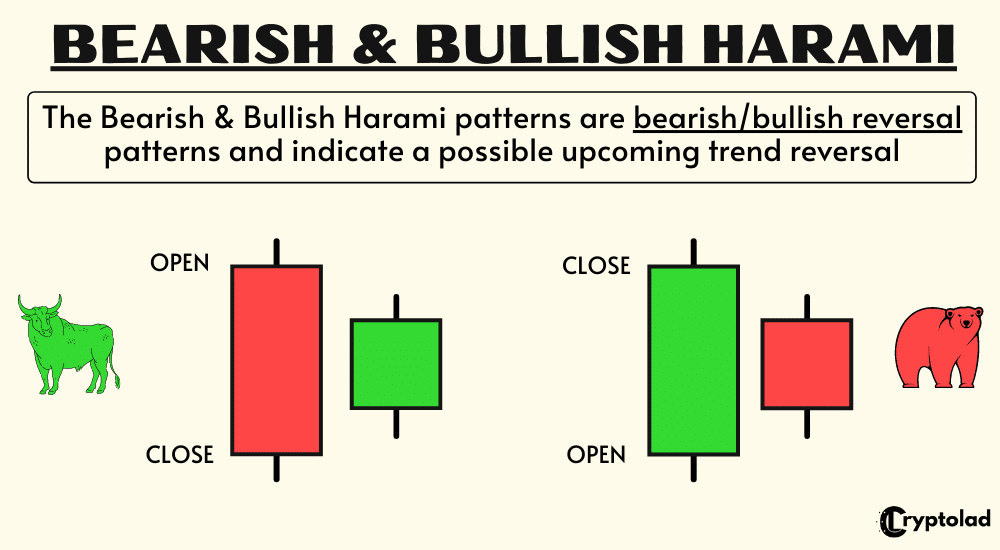
A Bearish or Bullish Harami will signal possible reversals in the trend.
“Harami” stands for “pregnant” in Japanese. So as you can tell, the name Harami was given to the candlestick pattern as the final view resembles a pregnant lady. The pattern’s second candle must be situated within the first candle’s body. This is true for both bearish and bullish Haramis.
An uptrend comes before a bearish Harami, and a downtrend arrives before a bullish Harami.
Dark Cloud Cover Candlesticks
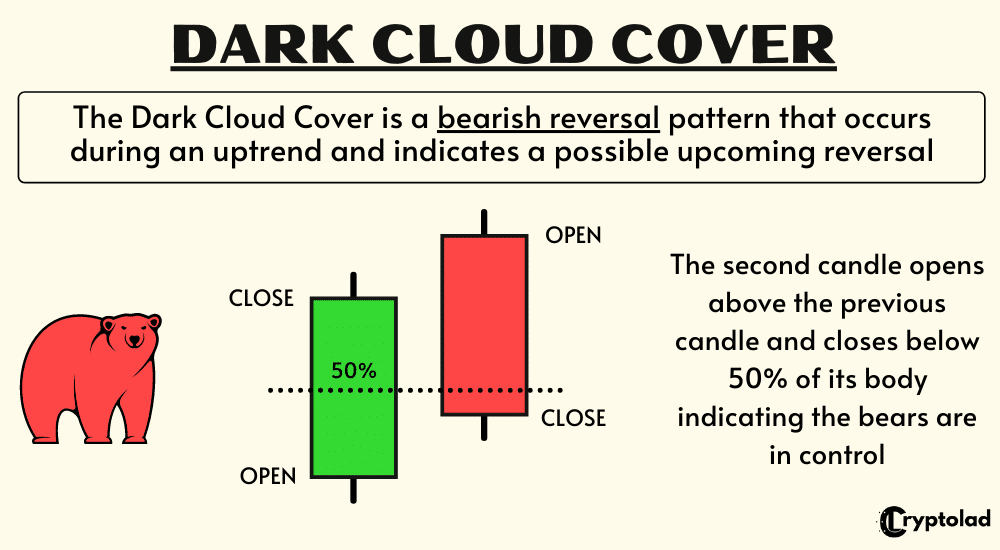
The Dark Cloud Cover candlestick pattern is considered to be a bearish reversal pattern. This pattern occurs amidst an uptrend.
While studying the chart, a bullish candle will precede a bearish candle.
Keep in mind that the bearish candle must abide by certain regulations to validate the mentioned pattern:
a. The closing price of one day must be less than the opening price of the next.
b. The closing price has to close under the middle of the former bullish candle.
The Dark Cloud Cover bears some resemblance to the Bearish Engulfing pattern. One variation between the two is the second candlestick.
While the Bearish Engulfing pattern features a second candlestick starting over the close of the first, the Dark Cloud Cover shows an open above the first candle’s high and closes under the middle of the first candlestick.
Piercing Patterns Candlesticks
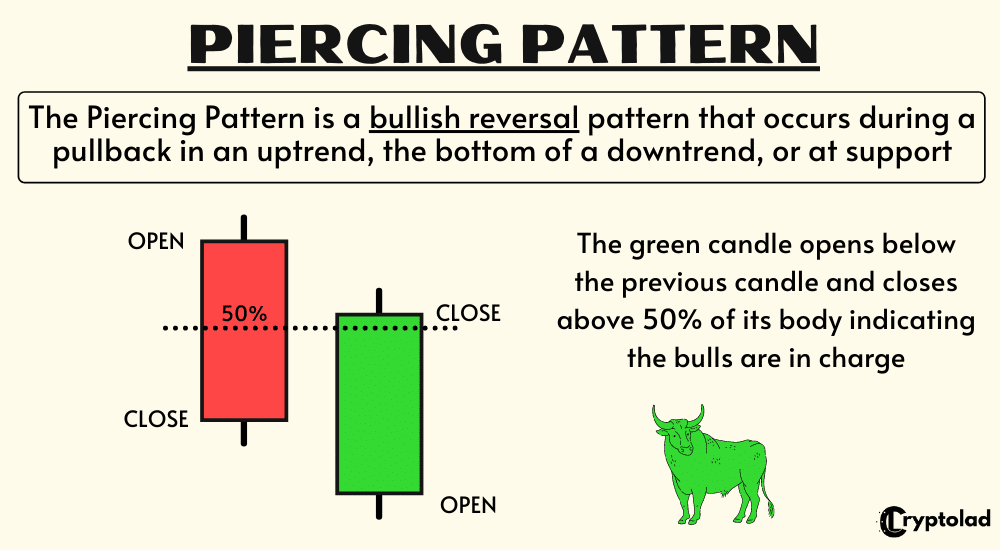
Considered to be a bullish candlestick reversal pattern, the Piercing Pattern appears during a pullback in an uptrend, the bottom of a downtrend, or the support.
There are two primary components of these formations:
1. Bullish Candlestick
2. Bearish Candlestick
We can notice a Piercing Pattern when the first candle (bullish) closes over the bearish candle's midpoint (first) during a downward trending market.
The second candle’s open price must gap down at the market opening and follow up by closing over 50% of the former candle.
In fact, Piercing Pattern and Dark Cloud Cover pattern share some similarities.
The difference is that the Dark Cloud Cover pattern signal a bearish reversal pattern whilst the Piercing line indicates a bullish reversal pattern.
Inside Bar Candlesticks
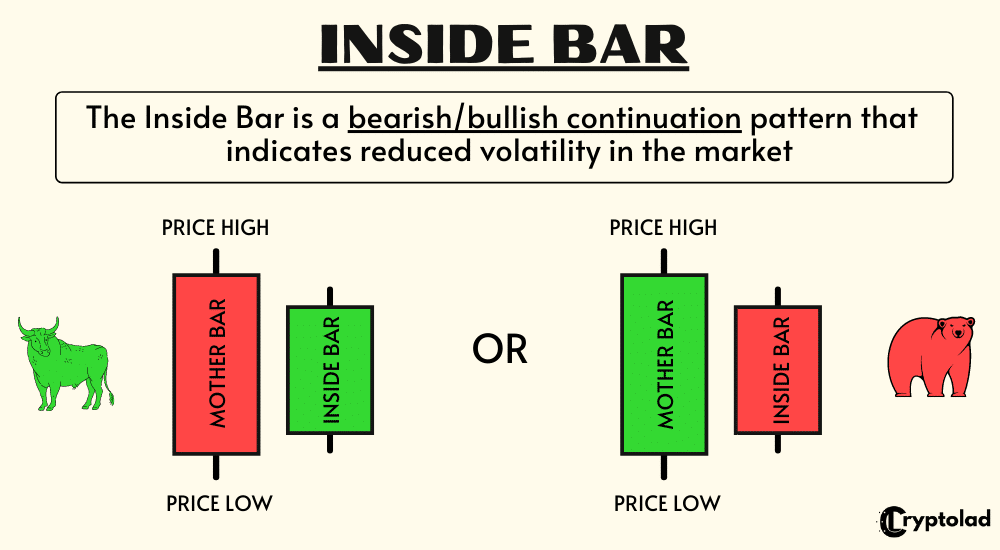
Trending markets often see the low and high of the Inside bar existing between the prior candle's parameters, also known as the mother bar. This is when an Inside Bar pattern is used.
They are traded amidst the trend’s direction – if the market is facing a downward trend, the trader would ideally wish to go on with a short position coupled with an Inside Bar’s presence. The same goes for an uptrend.
However, trading in the trend’s direction isn’t a constant because the primary levels of resistance or supports can signal a reversal.
Traditionally, traders' entrance points are placed over or under the mother bar's low or high based on the trade’s direction.
An Inside Bar also shares a close resemblance to the bearish or bullish harami candlestick pattern.
Just for the Inside Bar, the lows and highs are considered, but the actual body is disregarded.
Long Wick Candlesticks
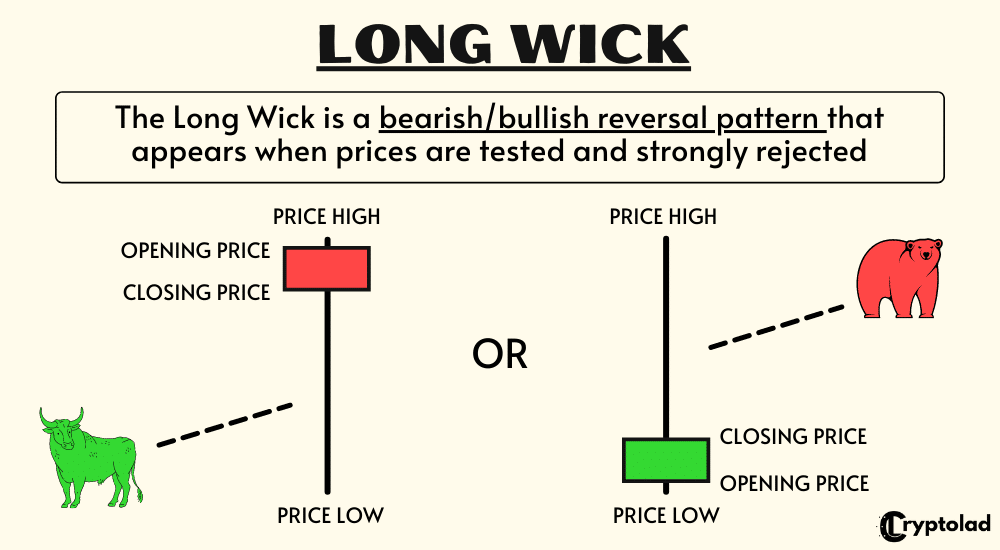
Typically, Long Wicks candlestick patterns say there will be a reversal in the trend.
These patterns appear when prices are evaluated, followed by a rejection. The wick shows the rejected prices.
Being able to identify the trend is key in interpreting the value of the Long Wick.
Shooting Star Candlesticks
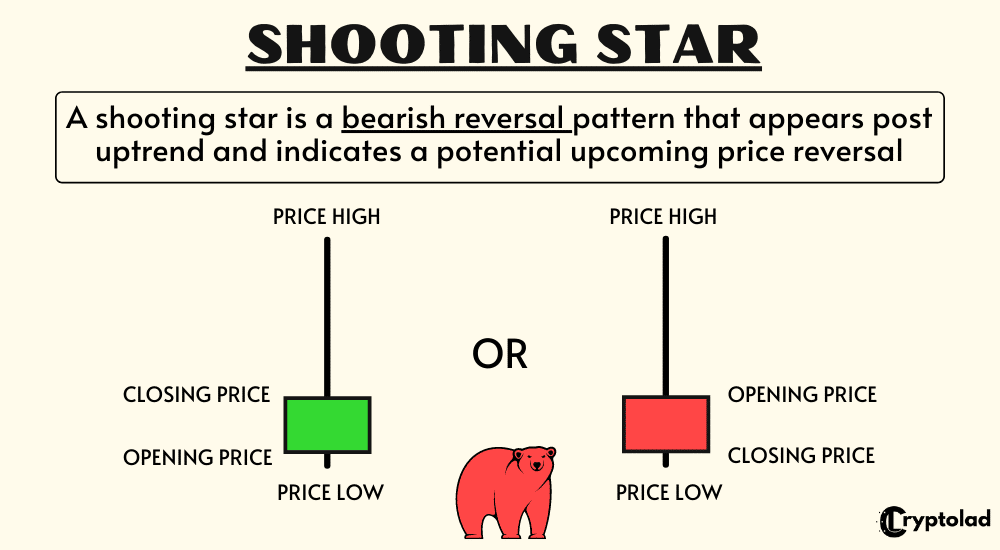
A Shooting Star comes as a bearish candle adjusted with a long upper wick, minimal or no lower wick at all, and a little real body placed close to the low of the day.
It comes post-uptrend and indicated a potential reversal in trend to the downside.
The space between the opening price and the candle's high should be more than twice as big as the Shooting Star body.
Similarly, the distance between the closing price of the day and the lowest price has to be very small, if not nonexistent.
Final Thoughts
Candlestick patterns attract the eyes of market players. But traders must never forget that many continuation and reversal signals given by these patterns don’t work with 100% accuracy in a modern-day electronic environment.
Thankfully, Thomas Bulkowski’s statistics offer unnatural efficiency even for a thin selection of such patterns, proving to provide actionable sell and buy signals.
Using the knowledge gained from viewing and evaluating candlestick patterns to invest in any asset revolving around them would need one brokerage account. Make sure to look for top-notch brokers for your investment needs.