Reversal Trading Explained

Reversal trading refers to the trading process where the course of a price trend has shifted from going up or down, or vice-versa.
Usually, reversals refer to major shifts in price, where the trend changes direction, pullbacks, or consolidations which are called small counter-moves against the pattern.
What is Reversal Trading?
When markets are in an uptrend, you might face constant selling at a certain point, markets go down again, people buy, and then you climb back up only to face more selling and then you fall yet once again. This means that investors are not willing to pay more than a certain amount. There is a constant supply in that area.
You can see an overwhelming number of sellers at this point that the market has to reverse.
Types of Reversal Trading
During formation, reversals can be difficult to detect, but after they develop, they are readily identifiable. The types of reversals about rising and falling price measures are described below:
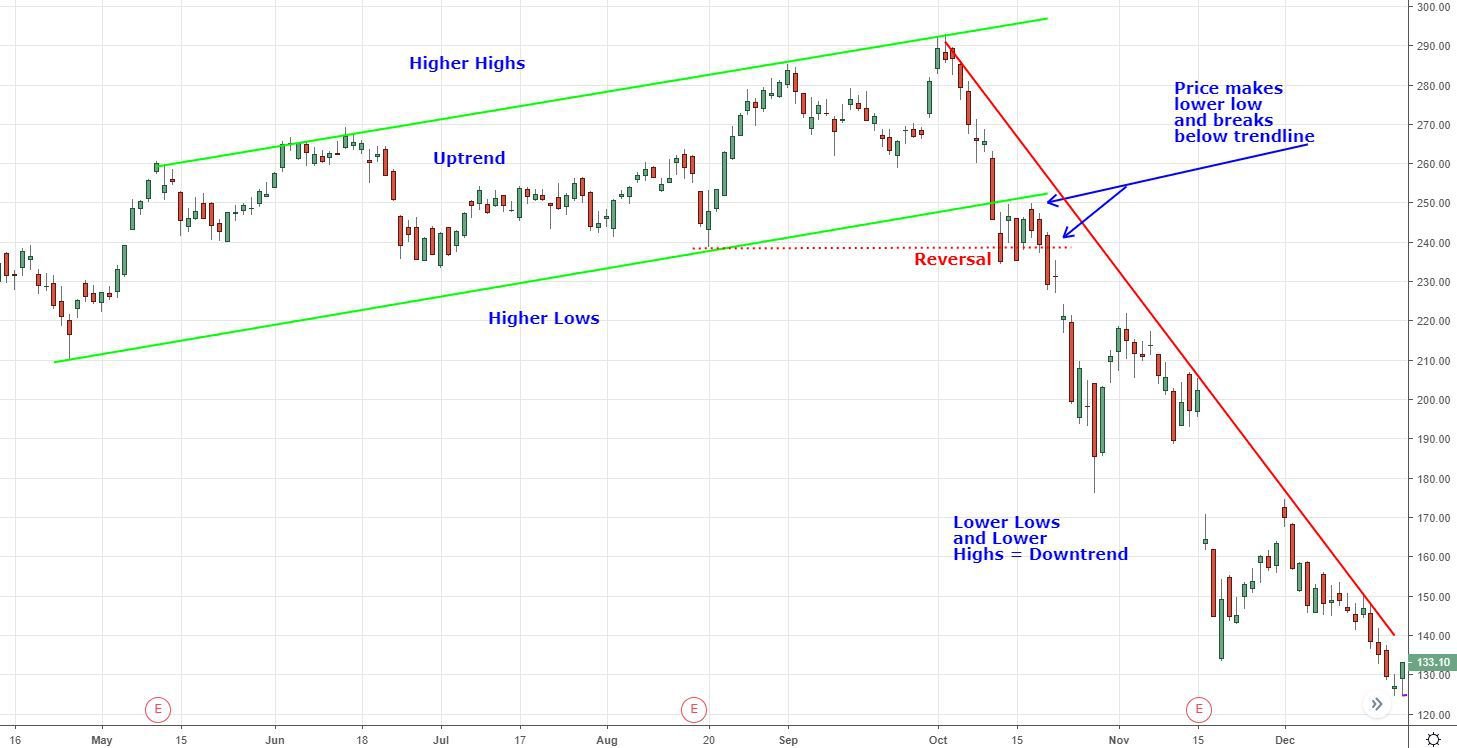
Uptrend
The uptrend is characterized as a series of periodic higher highs and higher lows, with an absolute high price value marking its eventual end. The reversal starts at the absolute high and consists of a downward trend in market activity, producing a variety of frequent lower highs and lower lows.
Downtrend
A series of periodic lower highs and lower lows are characterized by the downtrend, with an absolute low-price value being the exhaustion point. The reversal begins from the absolute low and is characterized by an upward trend in market behaviour, producing a sequence of higher highs and higher lows regularly.
Reversal trading also includes several patterns. The first one is the Double bottom that exists in down trending markets and then comes the Double top that exists in up trending markets. They both reverse the current trend. Then come the Inverted Head and Shoulders and the Head and Shoulders. The inverted one exists in a downtrend and the regular Head and shoulders exist in the uptrend.
In a Head and Shoulder trade, the market tried to break out three times and failed as soon as the neckline was reached. That’s when we know the supply was enough to push the markets down. The market moves in one direction several times and because it keeps failing, we know that something is not right and the current trade may reverse.
You first need a downtrend use for the double bottom and use this trade only in bear markets. The first V formation creates an area of support. When the market goes down, we rally and this happens because a lot of people bought a lot of stock. Hence, that area is an area of support. Then the same area of support is revisited. When we come close to the support area and bounce back up, this pattern is called the double bottom.
How to Interpret a Reversal Trade?
To identify when a trade is reversing, when to act and how to take full advantage, this article will introduce you to some simple methods.
Find a trend towards reversing
Don’t get confused about the specifics and get bogged down. To make it nice and tidy, clear all your indicators off your chart. You probably have something to work with if a pattern jumps off the screen. However, if your chart doesn’t have an obvious pattern, change the instruments.
For trade, there are thousands of markets. Keep searching before you see a trend jumping at you from the screen.
Decide what pattern reversal indicator to use
You can spot a trend reversal with the following indicators or chart patterns: Forex patterns and shift in waves. These are often referred to as Higher Highs and Higher Lows. This is one of the oldest and most-watched ways of identifying a trend.
Watching for crossovers is another common moving average approach. Often traders with algorithmic black boxes use moving average crossovers to track the health of a trend.
One of the benefits of this is that you can be sure of getting the same signal as the major traders. For years, traders have been using candlesticks to perceive market patterns.
The Trend Reversal Event
These are a certain collection of conditions that inform you until they unfold that there has been a pattern turnaround. As you go along, this isn't something you should think of. Your willingness to make simple choices would be clouded if you wait until you are in the midst of a moving market, and money is on the table.
Some of the trend reversal events include – Higher Highs and Higher Lows, Moving Averages, Chart Patterns, Candlesticks, and so on.
Taking the Trade Pattern Reversal
The signal you’ve been looking for has happened and now it’s time to take action. Traders also spend hours worrying about what they can do when the case occurs. Yet, they freeze as what they've been looking at finally happens. They start second-guessing themselves, adding new metrics into the equation, staring at varying timeframes, ultimately worrying about taking action. You need to have some confidence in your analysis, need to trust the chart, and take action!
Stay Consistent
This most important one of all is remaining consistent. Using the same indicator and the same rule over and over again means being constant.
Bottom Line
To know where to put your stop-loss, what your risk is, and what your potential reward is, you first need to know what is Reversal Trading and how to identify it. Those traders who misidentify reversal trades will suffer big losses and miss out on potential gains, either by not sticking to a good thing or by not pulling out at the right time. This article will help you to understand the concept of Reversal Trading which offers you a profitable way to trade the markets!