Moving Averages Explained

The world of trading is well acquainted with technical analysis. Traditional portfolios and even some cryptocurrencies make use of this technique. The goal is simple. Use existing data to make profitable decisions. Markets have evolved. So did technical analysis indicators.
The most popular indicator is moving averages.
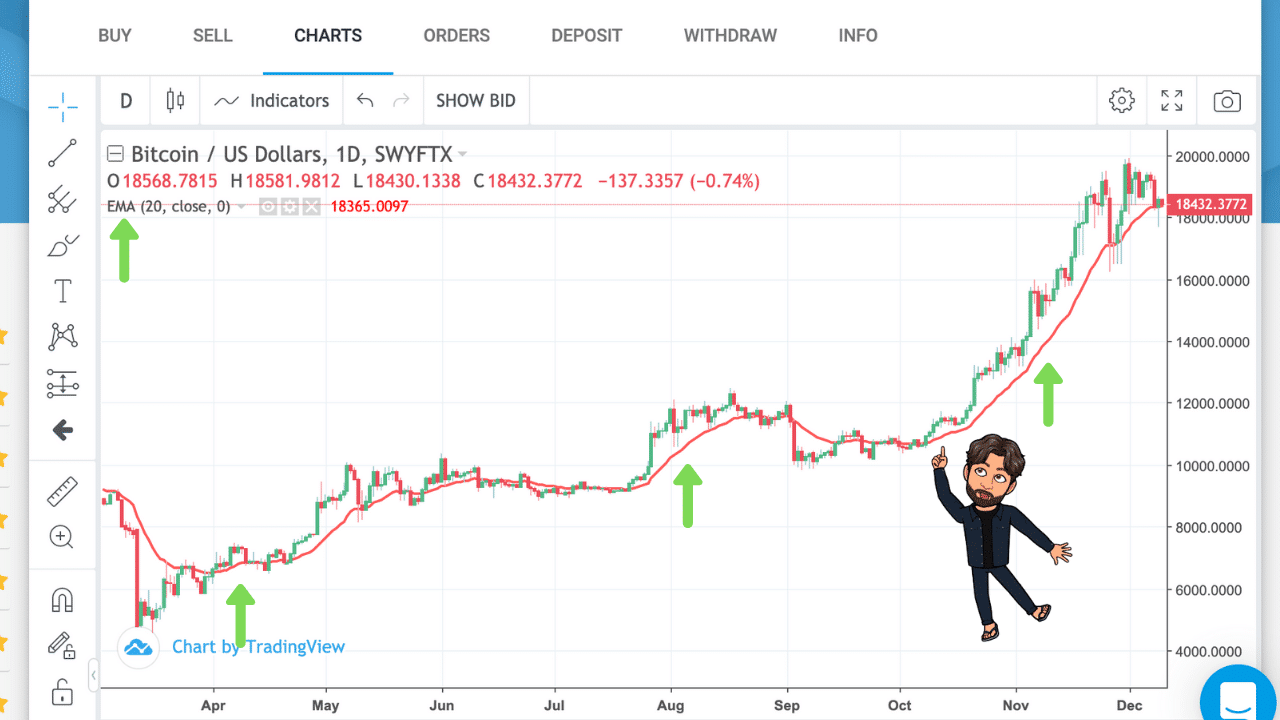
There are several types of moving averages. The underlying purpose of this is to bring clarity to trading charts. It helps detect a decipherable trend indicator. The process heavily relies on past data. So it is a bit behind compared to others. It still pinpoints where the marketing is heading better than most.
It is widely used in the cryptocurrency market too. Here, the moving average is used to smooth price action over a defined time. Always keep in mind that it’s based on previous data. So adapt your trading strategy accordingly. It’s a little intimidating for new investors but the results are worth the wait.
What Are the Different Types of Moving Averages?
There are multiple types of moving averages used by traders all over the world. It’s not limited to day trading or swing trading only. You can use this in the long run too. Traders adopt the technique according to their desired outcome and set-up.
The technique can be categories in two ways - simple moving averages and exponential moving averages.
- Simple Moving Average

Here, the data is collected from a set time and deduces the average price of the security. There is a primary difference between a simple moving average and a basic one. Once a new data set is introduced, the oldest is disregarded in the former. So if you were to calculate a week worth of data, it will include the last week only.
The data is weighted equally. This poses a problem to a few traders. They believe that the latest data has more relevance compared to the old one. The concluding result isn’t a well-rounded one. The technical analysis may not dictate the best outcome. To rectify this issue, the exponential moving average was introduced.
- Exponential Moving Average

This is also based on previous price fluctuations. The equation is more complex though. Here, more weight is placed on the latest price inputs. Both techniques are frequently used. This is more attuned to sudden price fluctuations and reversals. This is favoured by traders who trade in the short term.
So How Can We Use Moving Averages?
Moving averages deal with past prices instead of current ones. This invites a period of lag. The larger the data set, the more significant the lag is. This is because a new entry in a large data set will have a negligible effect on the result. Long-term investors gravitate toward this.
This is because there is less fluctuation present. There are minimal alterations. On the other hand, short-term traders prefer smaller sets. A traditional trading market considers moving averages of 50, 100, or 200 days. The 50 and 200-day are closely watched.
Any fluctuation above or below these markups is considered to be important signals. Especially when crossovers follow. So what are crossovers signals?
A rising moving average suggests an upward trend and vice versa. Moving average on itself isn’t a reliable indicator. That’s why they’re always combined with bull or bear crossover signals. These signals are created when two varying average crossovers in a particular chart.
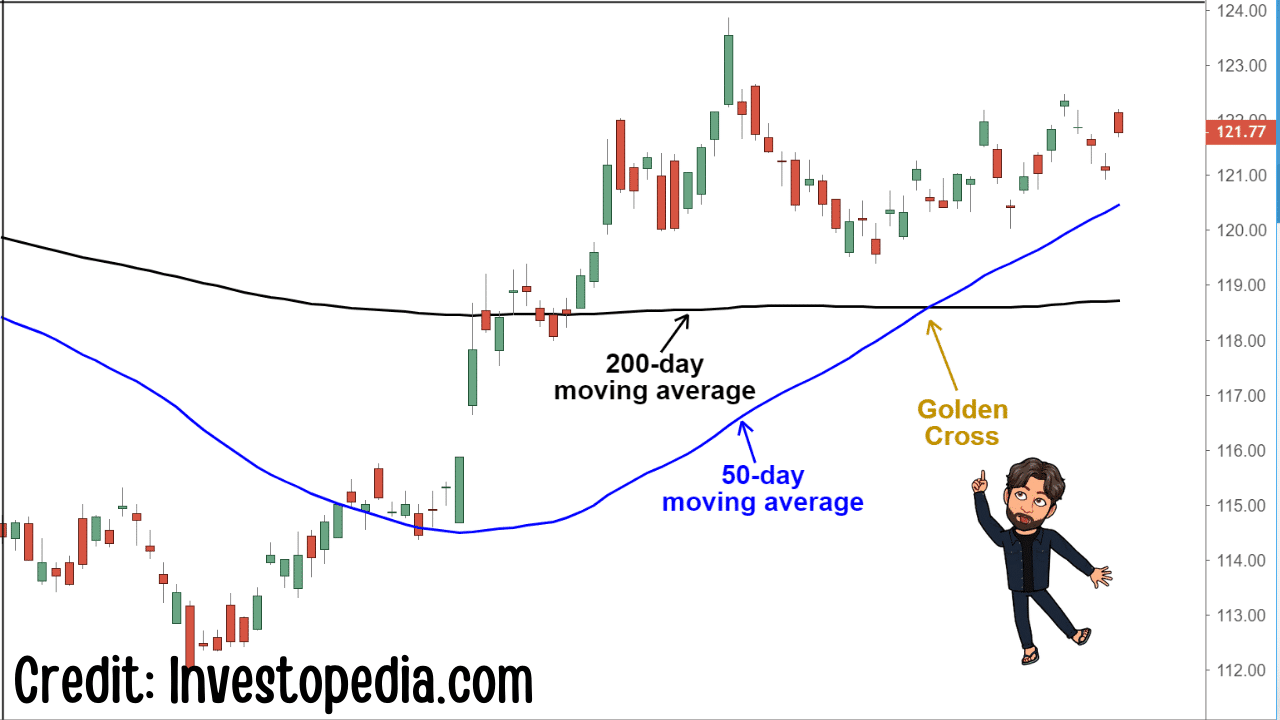
A bullish crossover takes place when a short-term moving average crosses over a long-term one. It’s also called a golden cross. This suggests an upward trend. On the other hand, a bearish cross over takes place when a short-term moving average goes below a long-term one. This leads to a downward trend.
Some traders are more concerned with asset performance of the last few hours than months. Varying time frames are incorporated in calculations to determine moving averages. The time frames need to be consistent. The lag time is significant otherwise. The signals end up being late.
A bullish crossover may suggest the trader a buy. The time lag may suggest otherwise. The upward trend may continue and the potential profit may be lost on the process. In other cases, traders may buy right before a price drop. These signals are referred to as a bull trap.
What Are Some Strategies Associated With Moving Averages?
The golden cross and death cross are the most common strategies used. The former is considered to be a strong indicator of upward trends. It’s perfect for cryptocurrency traders looking for a buying opportunity. It’s used with momentum indicators to provide clear market conditions.
A death cross looks into downward trends. It’s said to be the harbinger of downturns. This strategy doesn’t always result in fast cash. Some require quick corrections. Once that’s done, it brings in good sell indicators. The idea is to look for trend confirmations.
A moving average formula can also support or resist an asset’s price. It depends on whether it’s an upward trend or a downward one. Cryptocurrency traders use this to track price movements. They can also use this to build the basis of other technical indicators and trends.
How Do You Know Which Period to Pick?
The length of your moving averages depends on your trading style. A short-term trader will elect a shorter moving average. While a long-term trader will opt for a long one. Regardless of the period you pick, a moving average acts as a form of support and resistance. Long time frames indicate stronger ones.
Conclusion
Moving averages are one of the strongest trend analysis indicators. The strategy is enough to meet the needs of short-term and long-term traders. It depicts an accurate picture of the market. Especially if it combines different indicators.
There are some risks involved. Conjoining it with trading bots eliminates the uncertainty though. It’s also one of the easiest indicators to understand. So if you’re looking for clear signals to trade, moving averages should be your go-to strategy!
